The Laser Spot section enables you to configure and customize the laser spot parameters used in LIATool. These settings allow precise control over the laser’s shape, size, and intensity, ensuring accurate simulations and optimal surface treatments. Follow the steps below to configure laser spot parameters.
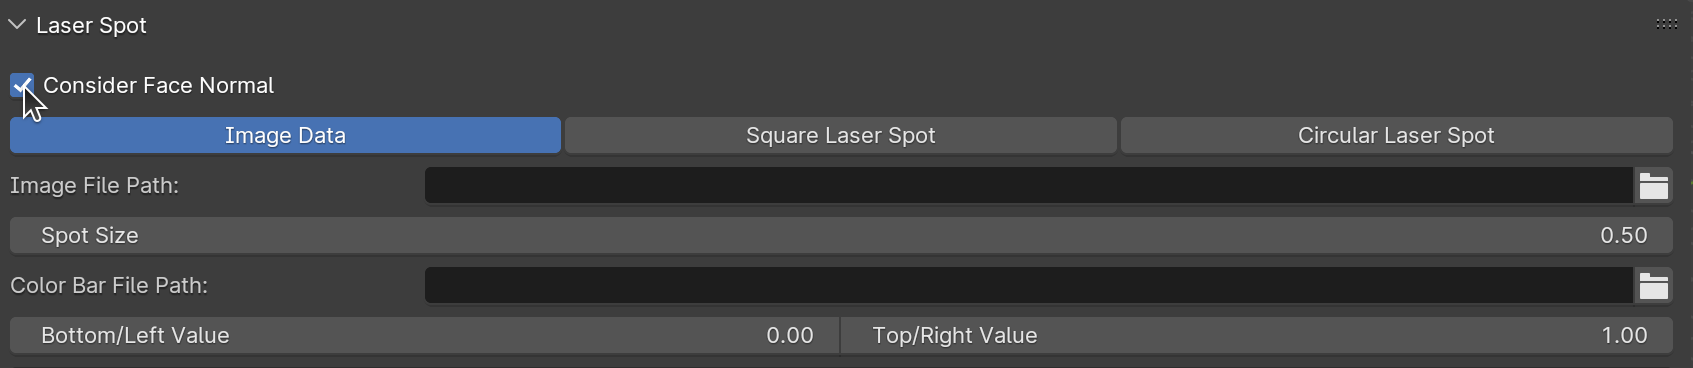
Access the Laser Spot panel in the LIATool addon. This panel allows you to view and modify laser spot parameters and includes the Consider Face Normal feature, which adjusts the laser’s impact based on the angle between the beam direction and the surface’s face normal.
The Consider Face Normal option is a crucial feature for accurate simulations, especially for objects with complex geometries. When enabled, this feature modifies the laser intensity based on the angle of incidence. It ensures that the laser’s effect is stronger when it is perpendicular to the surface and weaker when the angle is more oblique.
Beam and Face Normal Alignment: The software calculates the alignment between the laser beam direction and the face normal of the object’s surface. This alignment determines how much of the laser’s energy is effectively applied to the surface.
Realistic Intensity Distribution: By simulating the angular dependence of the beam, the software provides a more realistic representation of laser-material interactions. This feature is particularly useful for analyzing areas where the beam hits non-orthogonal surfaces.
Applications: This functionality is critical when working with curved or angled surfaces where the beam’s interaction varies across the domain. It allows you to identify zones of high or low energy application and optimize the laser treatment path accordingly.
Accessing the Laser Spot panel and enabling the Consider Face Normal option to account for beam and face normal alignment.
By enabling this feature, you ensure that the simulation reflects realistic laser interactions, improving the precision of your treatment designs.
Choose the shape or type of the laser spot using the horizontal enum options. The available options provide flexibility for different treatment designs and include the following:
Image Data
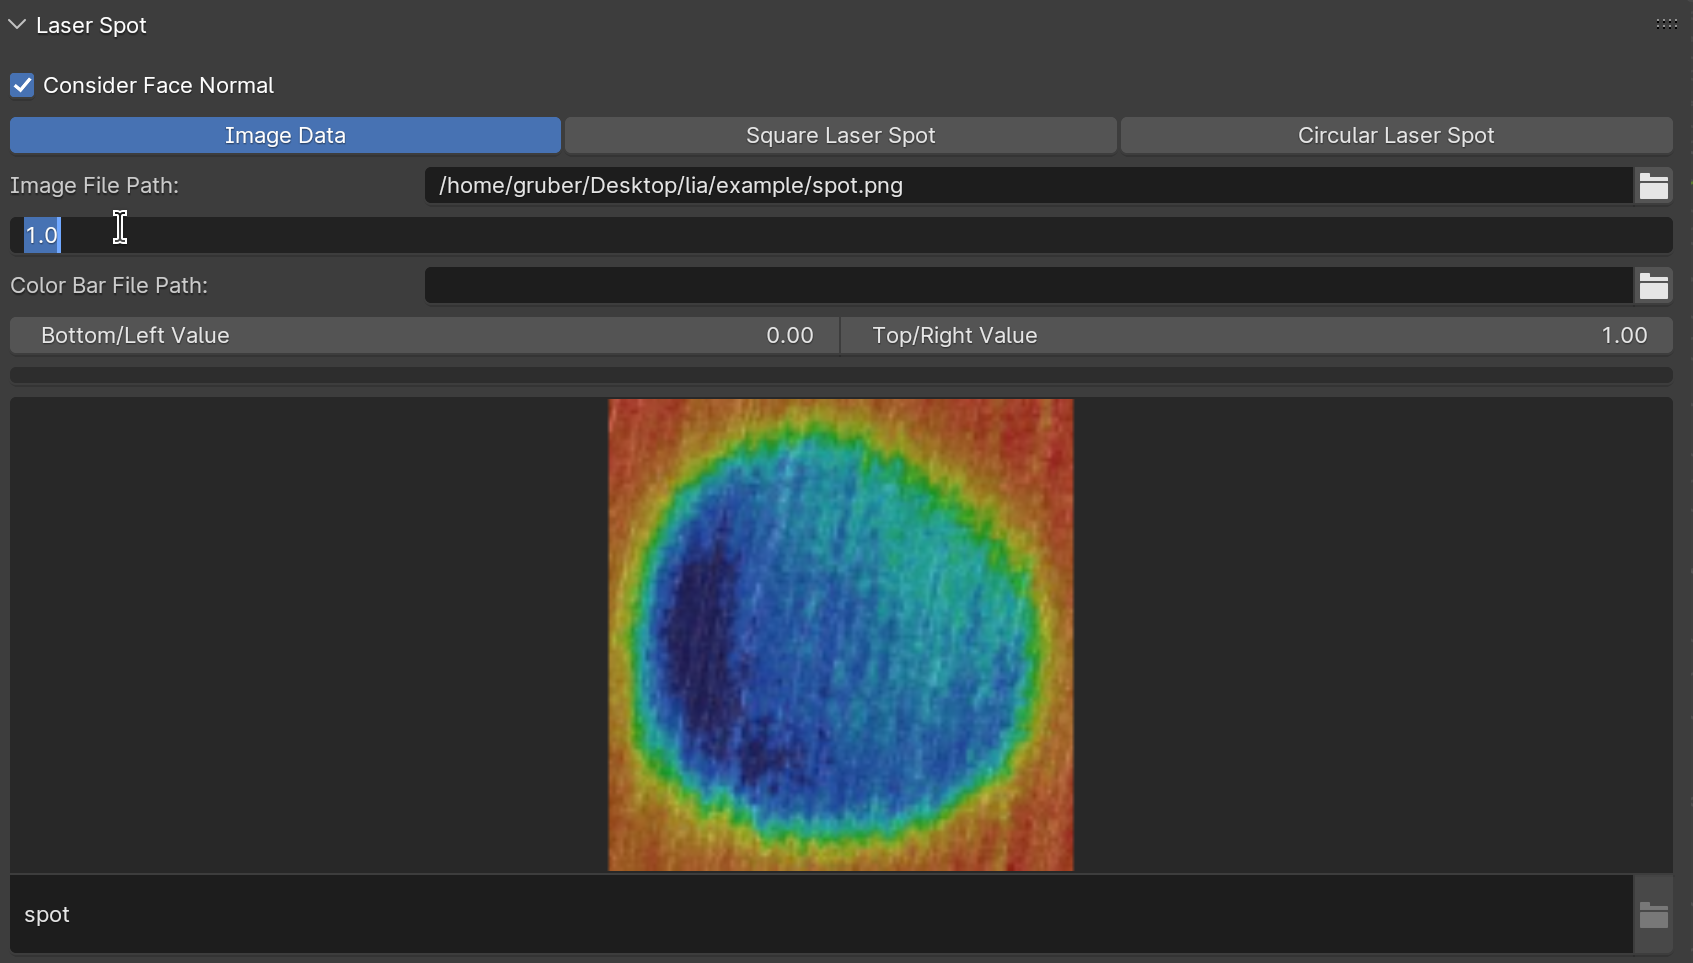
This option allows you to project a custom laser intensity pattern using a PNG image. The image defines the shape and intensity distribution of the laser spot, enabling highly customizable designs for advanced treatments. Useful for simulating complex beam profiles or custom intensity distributions.
Circular
A parametric circular laser spot is defined by a piecewise linear function that starts at the center of the circle and extends to the edge. This definition ensures precise control over the intensity distribution across the spot area.
Square
A parametric square laser spot is also defined by a piecewise linear function starting at the center and extending to the edges of the square. This approach provides accurate control over the energy distribution within the square area, making it ideal for grid-like treatments or targeting rectangular zones.
By selecting the appropriate option, you can adapt the laser spot to fit the specific requirements of your surface treatment process.
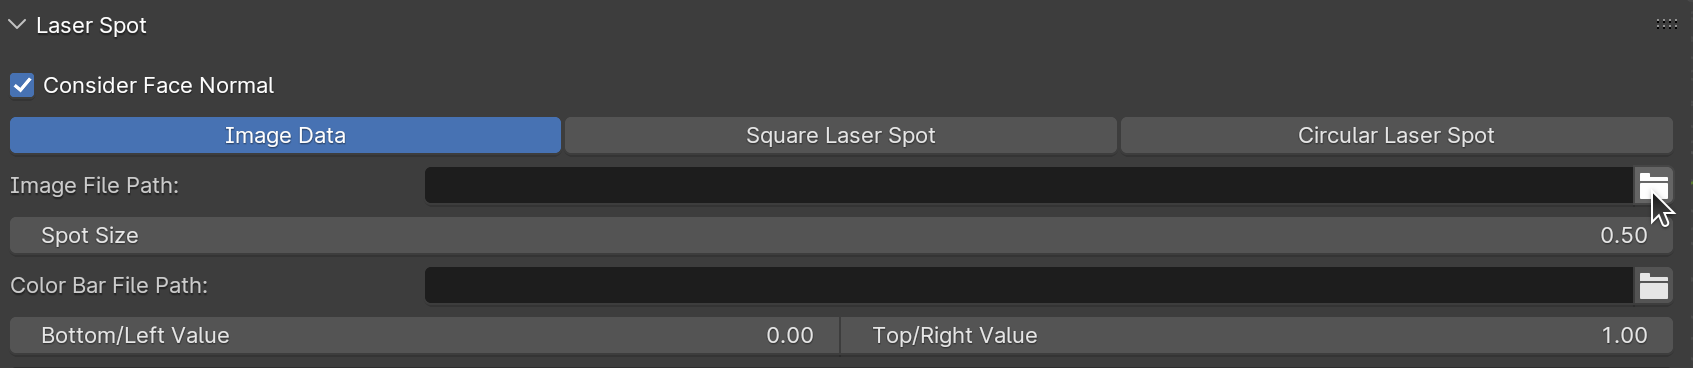
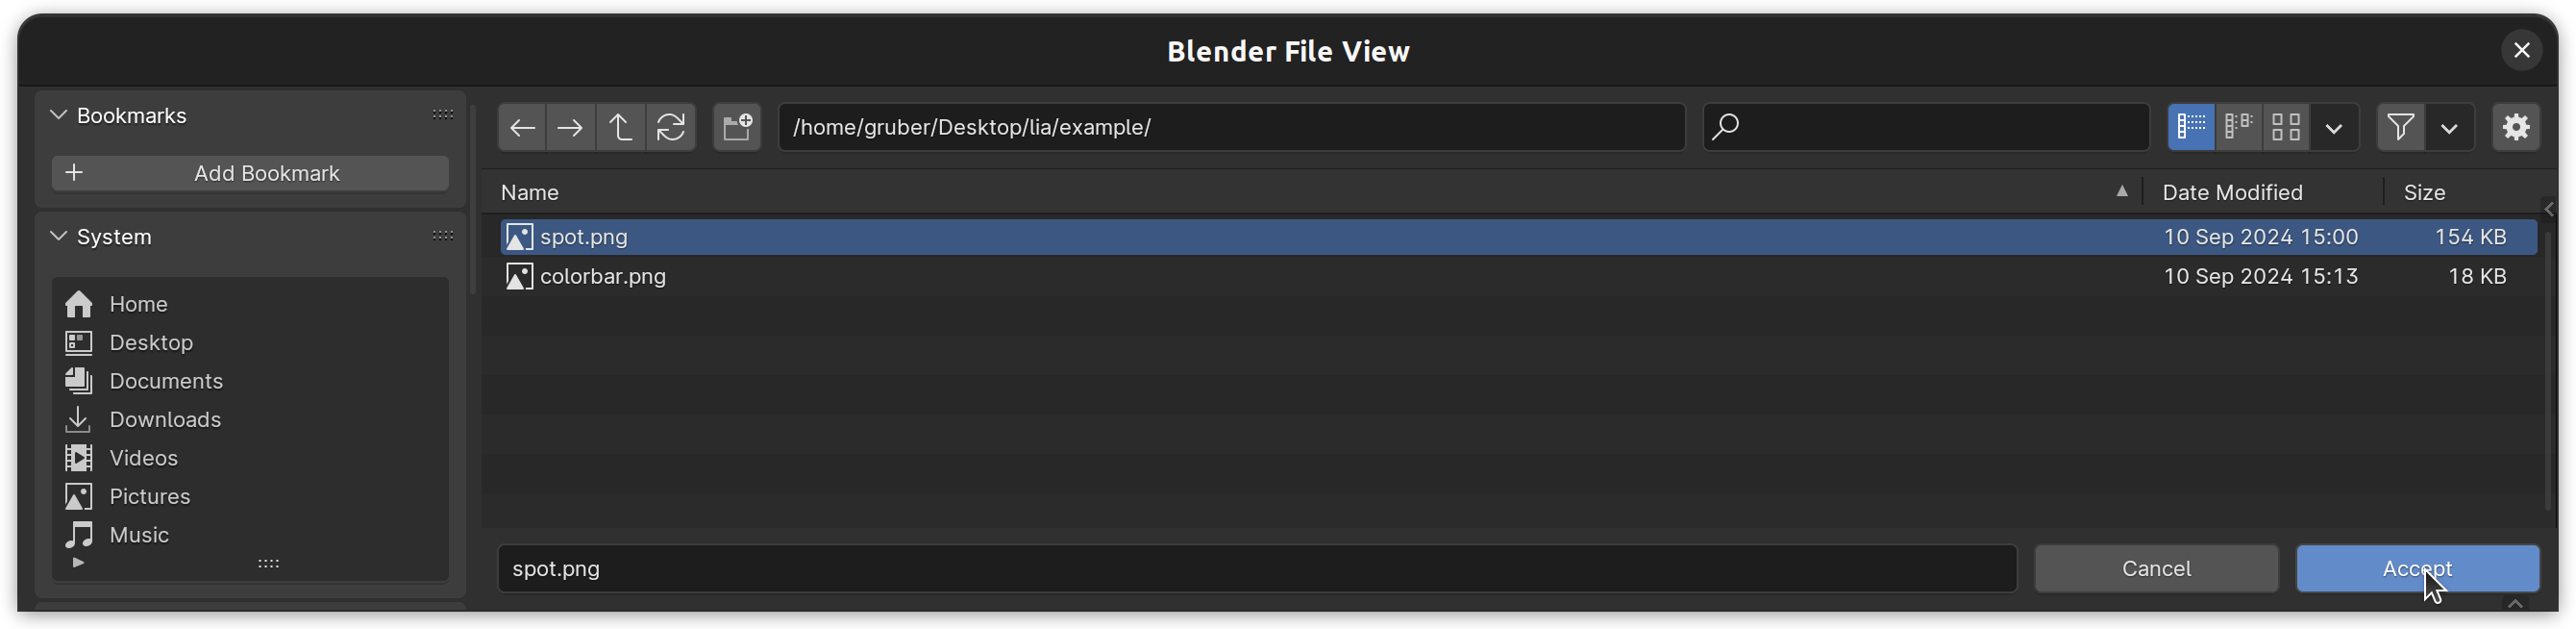
Use the file browser button next to the Image File Path field to load your PNG image. The image file should represent the intensity distribution of the laser spot, with pixel values defining the relative intensity at each point.
Loading a PNG file to define the laser spot shape and intensity distribution.
Set the size of the laser spot by adjusting the diameter (for circular shapes) or side length (for square shapes). The size determines the area affected by the laser treatment.
Adjusting the laser spot size using the provided input fields.
Configure Color Bar
The Color Bar is a required feature for mapping intensity values in the laser spot to a color gradient. This gradient provides a visual representation of the laser intensity distribution, making it an essential component for accurate and interpretable simulations. Follow these steps to configure and import the color bar:
Load a Color Bar File
To load a color bar for the laser spot:
Select the Color Bar File
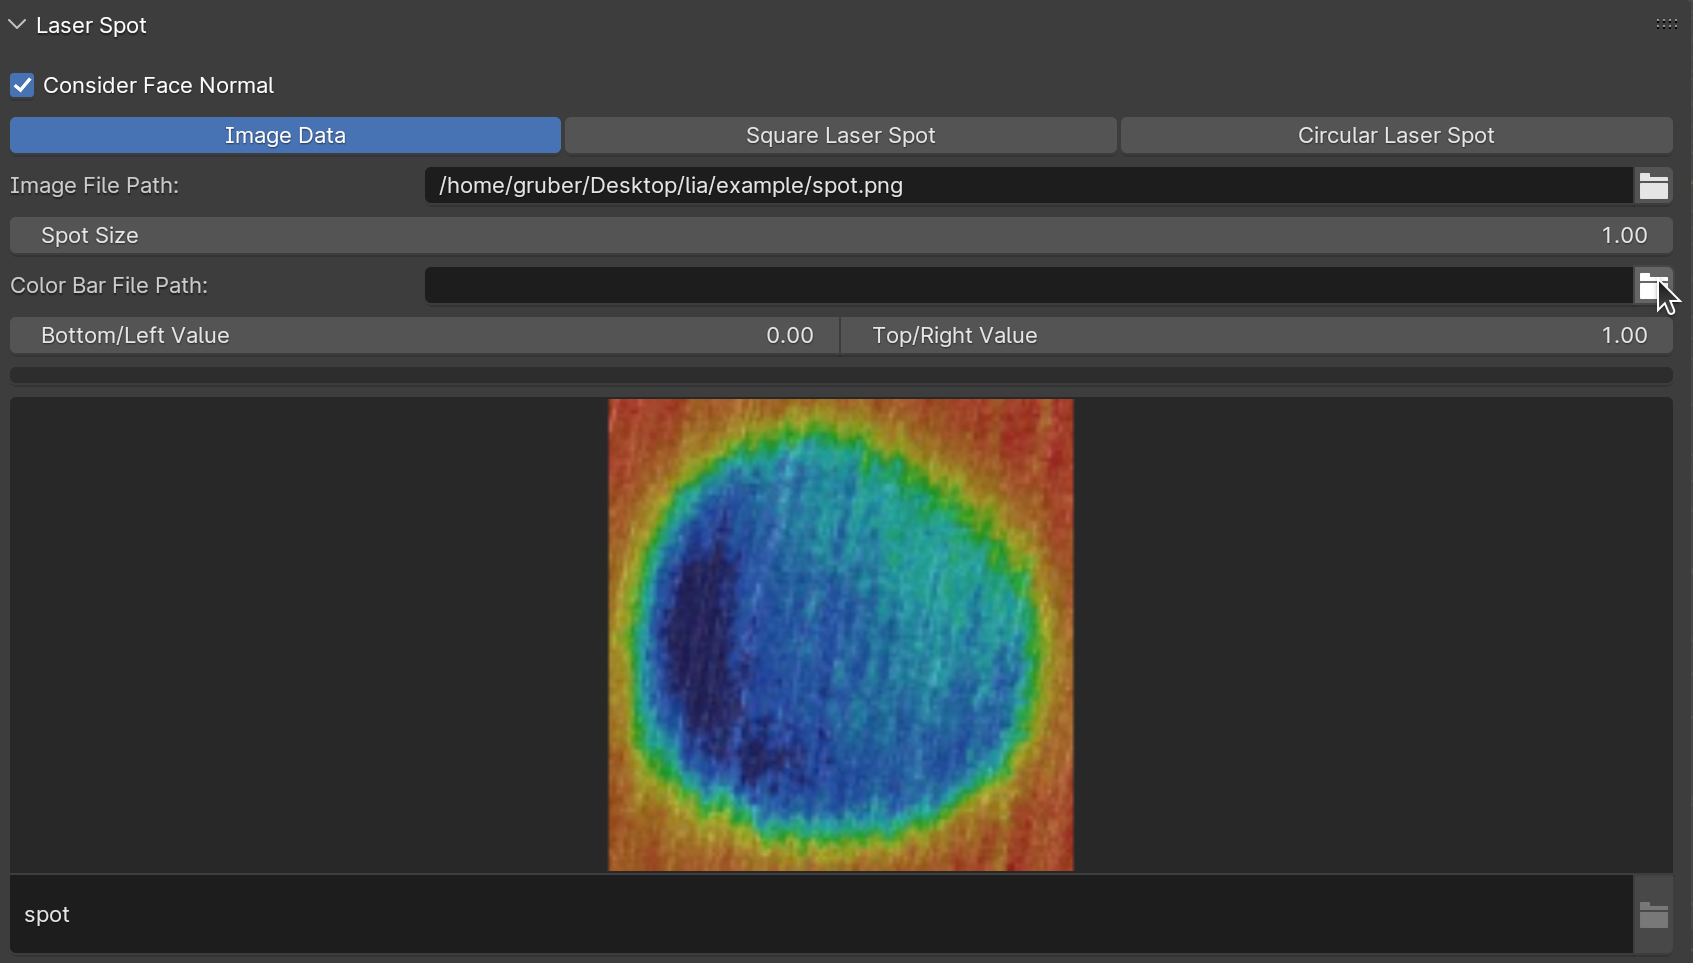
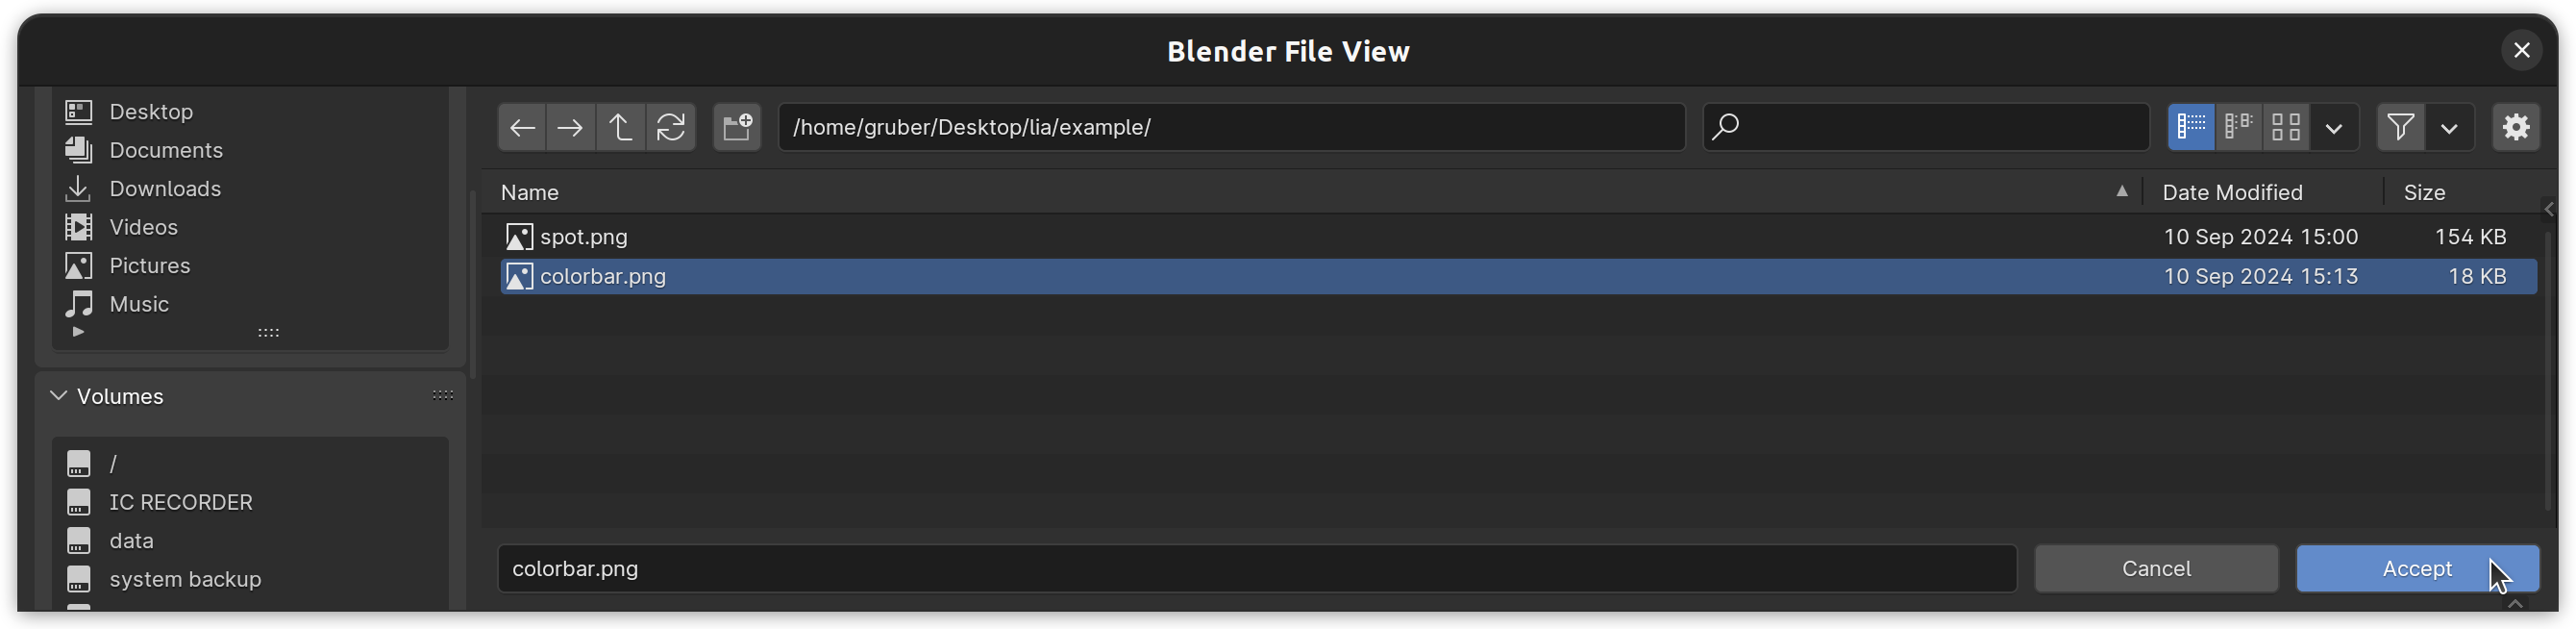
Use the file browser button next to the Color Bar File Path field to load your color bar image. The file must be a PNG image containing a vertical gradient that represents the range of intensity values.
Loading a mandatory color bar PNG file to map intensity values to colors.
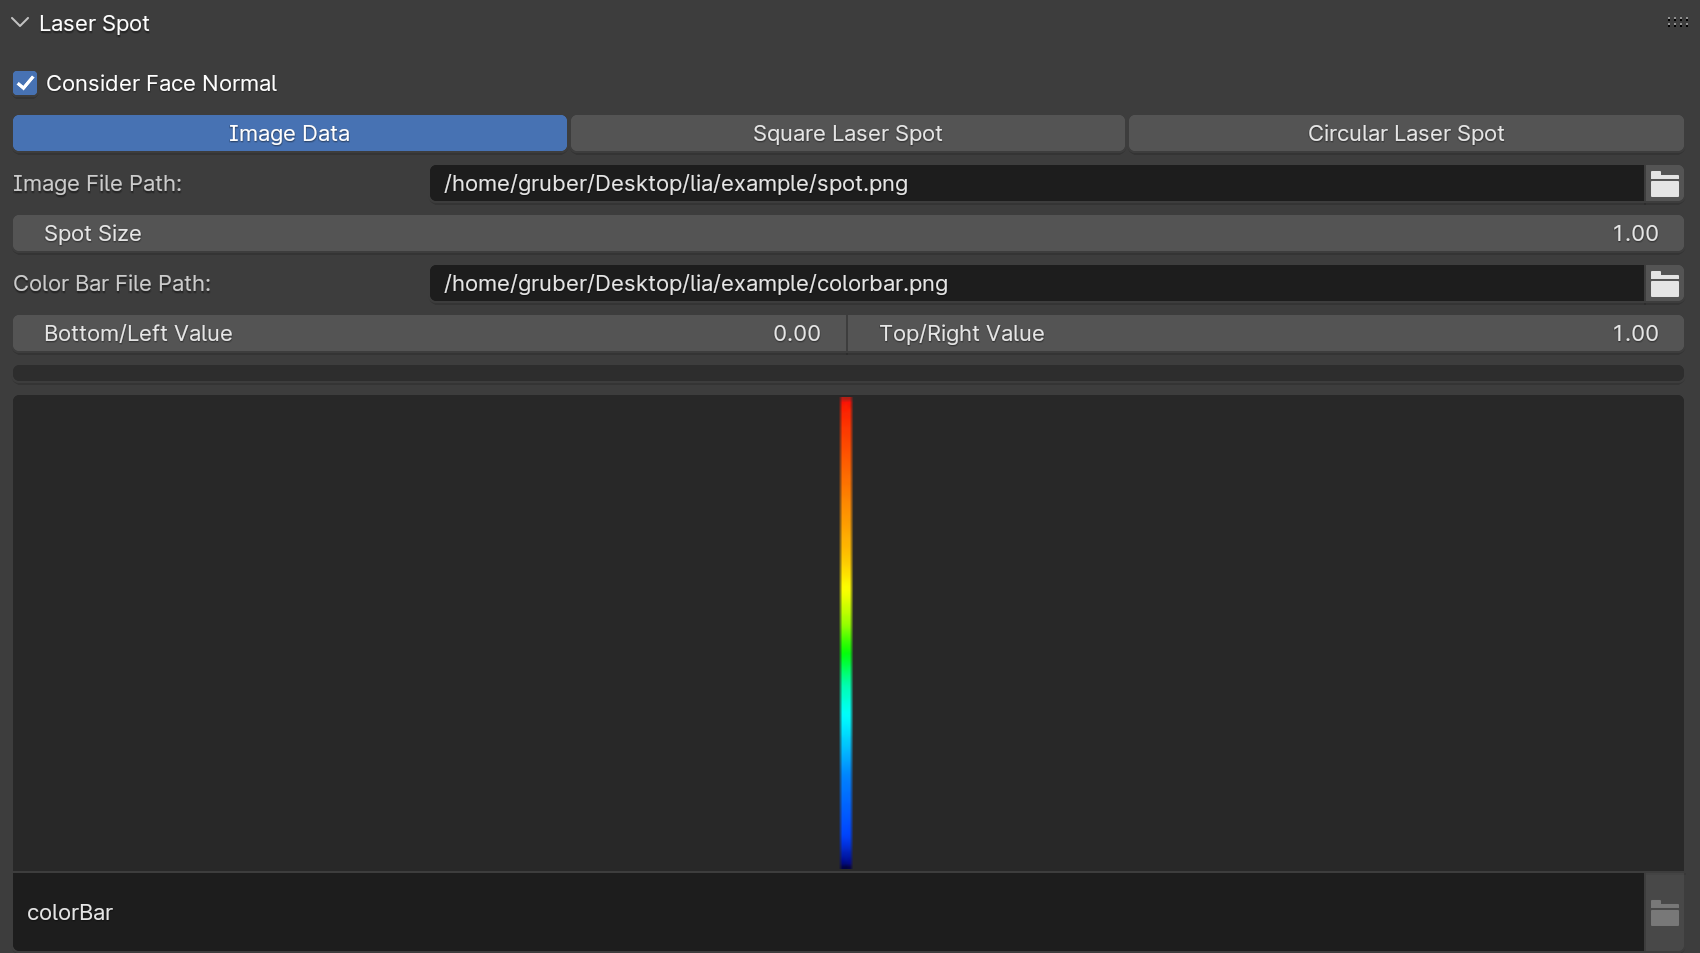
Loading a color bar PNG file - color bar uploaded.
Verify the Color Bar
After selecting the file, the color bar will appear in the preview window below the Color Bar File Path field. Ensure that the color gradient accurately matches the intended intensity distribution.
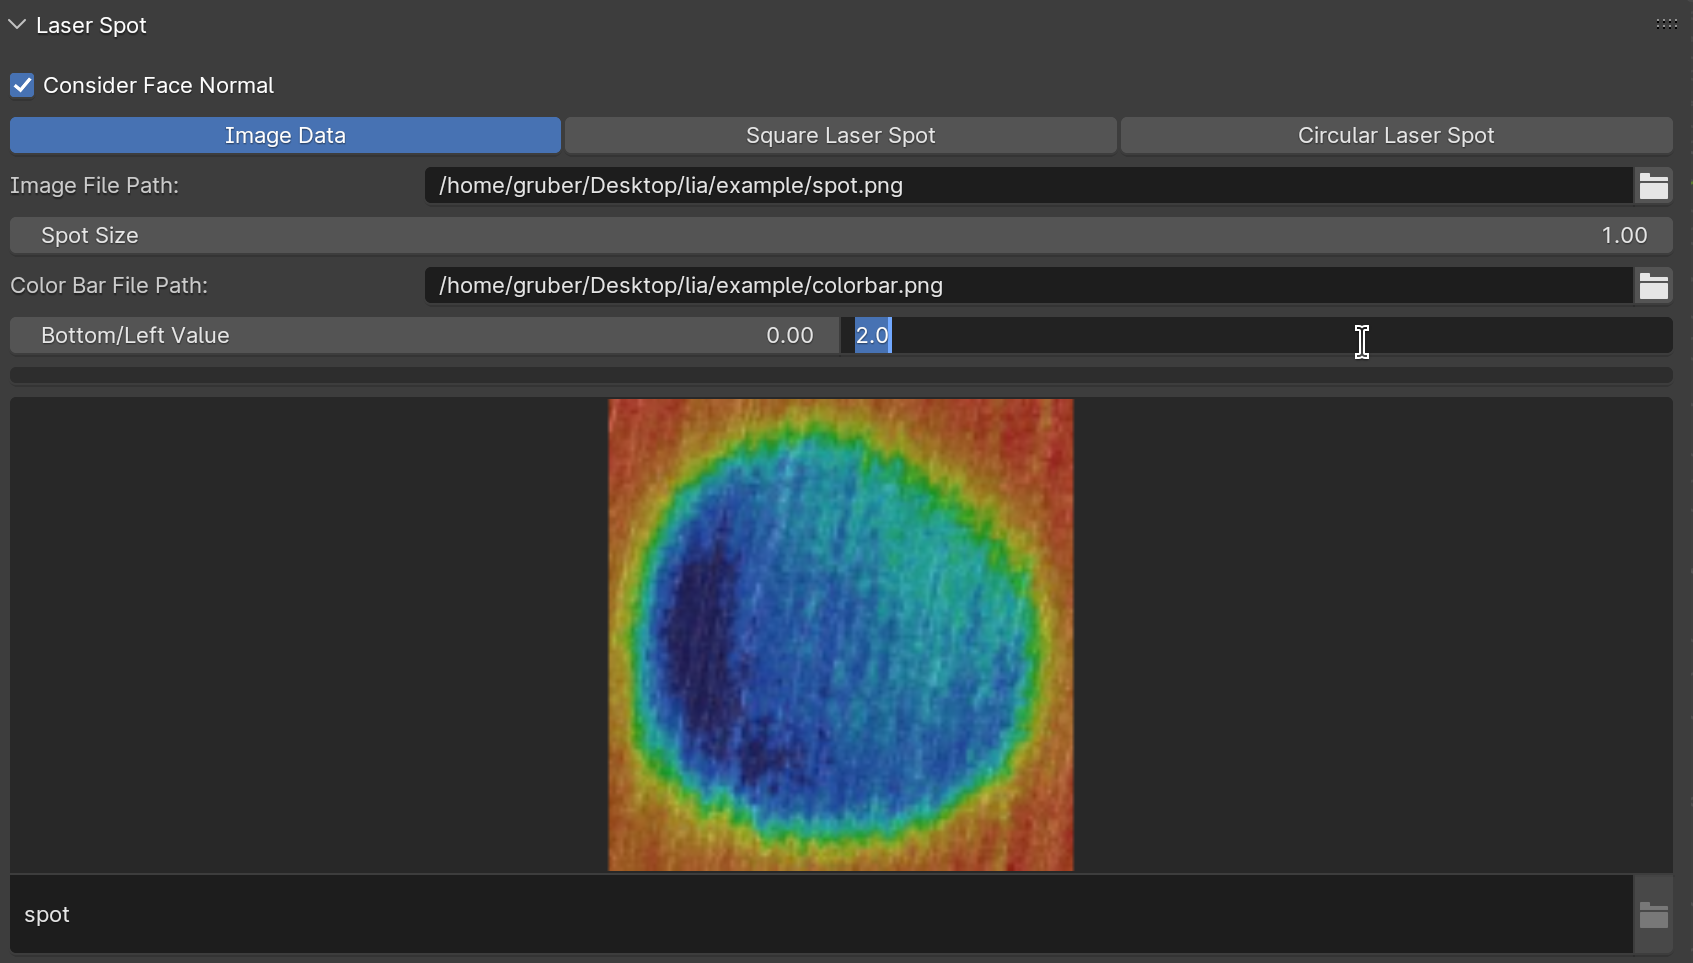
Set the intensity range that the color bar will represent:
Bottom/Left Value:
Specify the minimum intensity value represented by the bottom of the color bar (e.g., 0.00).
Top/Right Value:
Specify the maximum intensity value represented by the top of the color bar (e.g., 1.00).
These values define the mapping of intensity levels in the laser spot to the colors in the color bar.
Interpretation:
The gradient in the color bar will map each intensity level to a color, with lower intensity values corresponding to the bottom of the bar (e.g., blue) and higher values to the top (e.g., red).
Practical Tips
Ensure the color bar gradient is smooth and visually distinct for effective interpretation of intensity variations.
The color bar is particularly important for Image Data laser spots, where non-uniform intensity distributions require detailed visualization.
Experiment with different intensity ranges to highlight specific areas of interest in the simulation.
The Color Bar is a critical component for accurately interpreting and visualizing the laser intensity distribution. Its correct configuration ensures the precision and effectiveness of your treatment designs.
The Square Laser Spot option allows you to define a laser spot with a square shape. The intensity profile is defined using a piecewise linear function. This function specifies intensity values at different radii from the center to create a precise intensity distribution, including the ability to simulate rounded corners outside the pure square region. Follow these steps to configure the square laser spot:
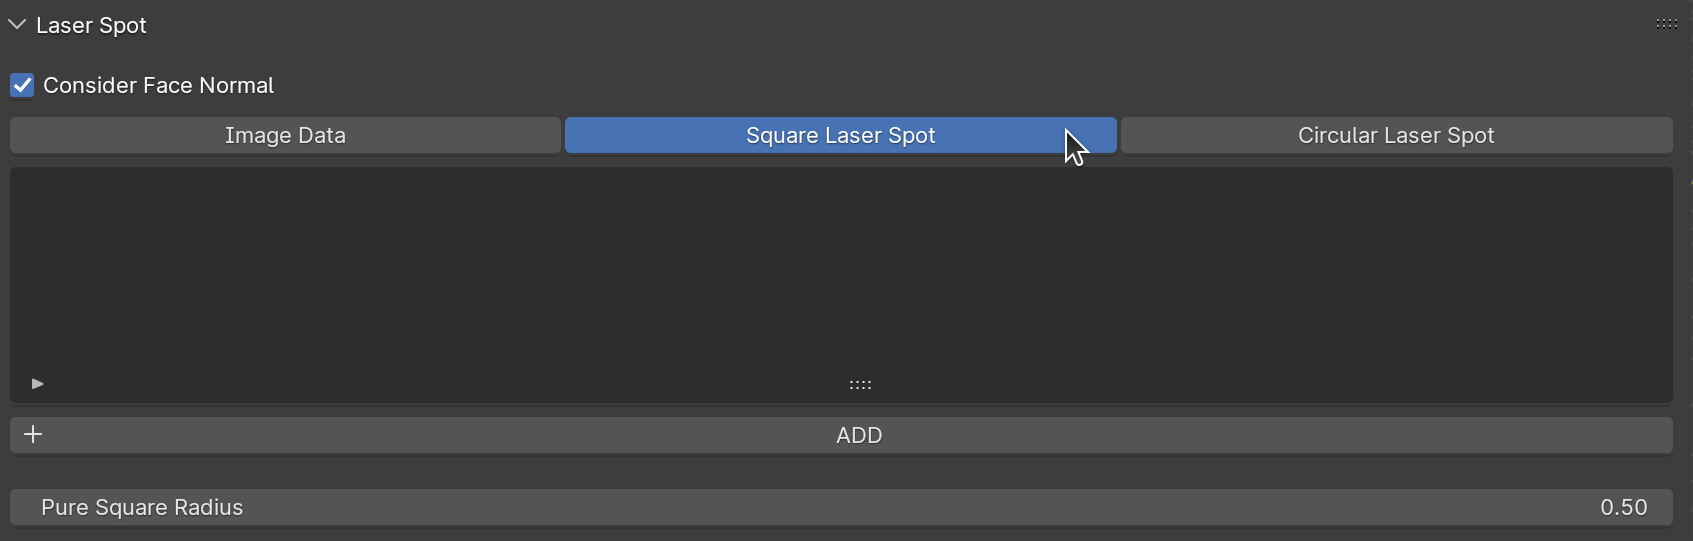
Select Square Laser Spot Type
In the Laser Spot panel, select the Square Laser Spot option from the horizontal enum. This activates the configuration options for defining the square laser spot.
Selecting the Square Laser Spot type from the laser spot options.
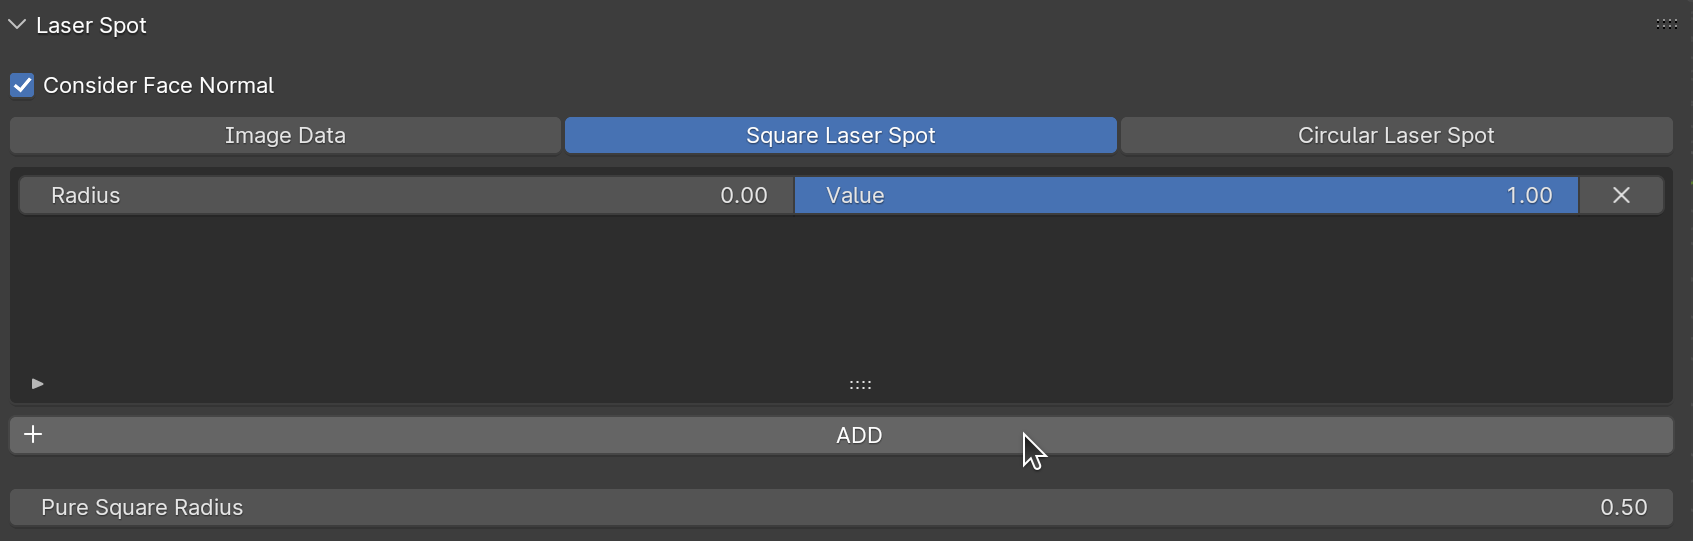
Add the First Control Point
Click the ADD button to insert the first control point. The first point is automatically positioned at the center of the square spot (radius = 0.0) with a default intensity value. This control point ensures the intensity is defined at the center of the spot.
Adding the first control point at the center of the square laser spot (radius = 0.0).
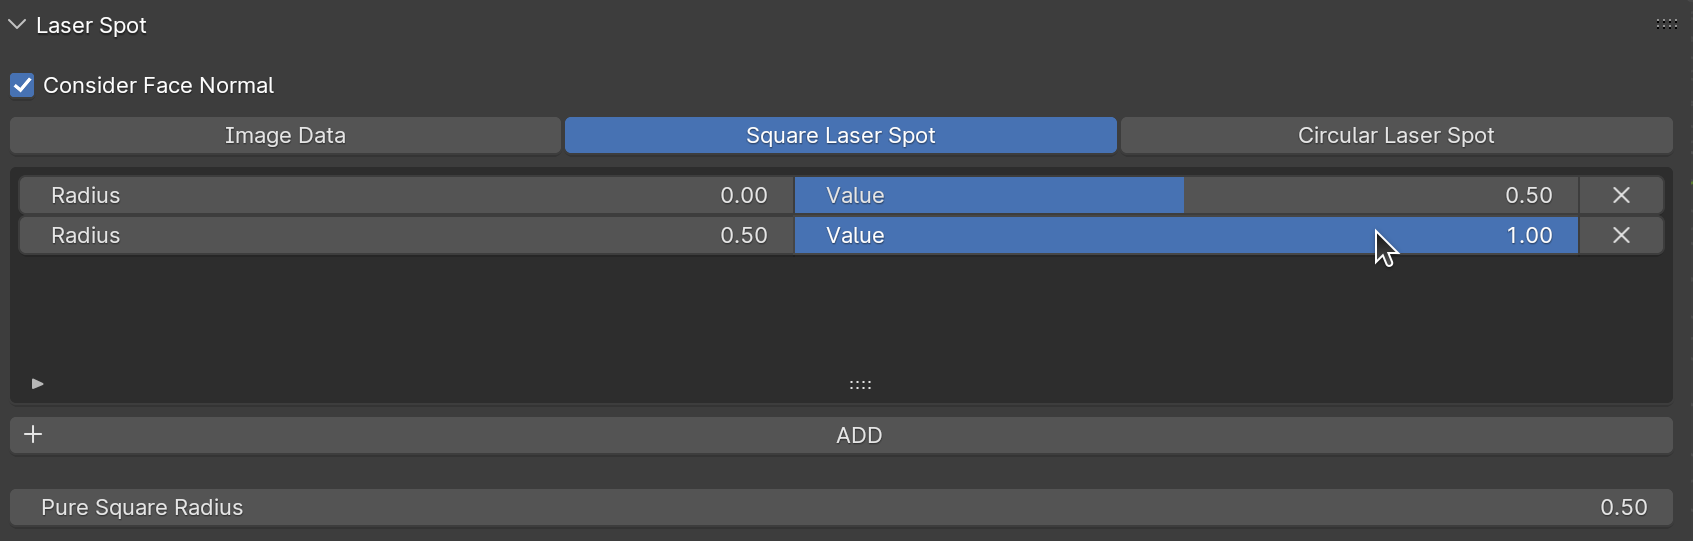
Add the Second Control Point
Click ADD again to create a second control point. This point allows you to define the intensity at a specific radius from the center, contributing to the piecewise linear intensity profile. The spacing between control points determines the gradient of intensity changes across the square spot.
Adding the second control point to define intensity at a specific radius.
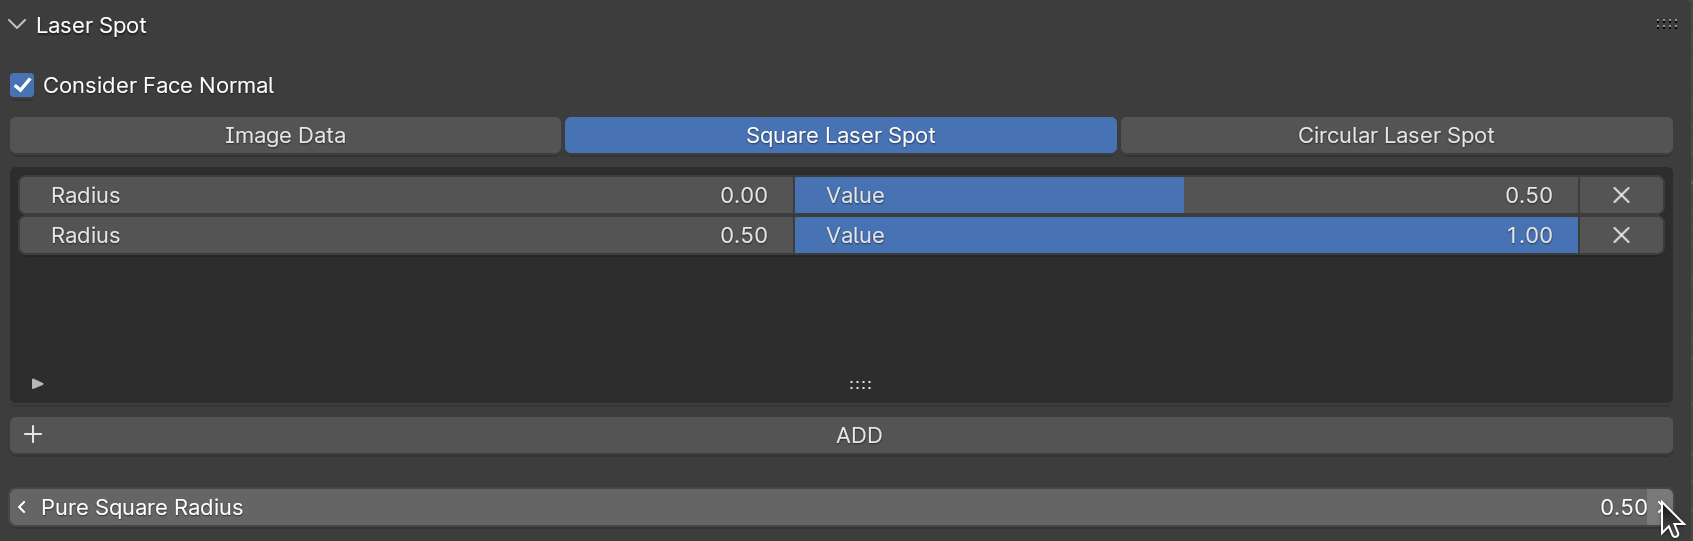
Set Pure Square Radius
Adjust the radius of the second control point to define the pure square region. The pure square region is the central area where the spot maintains sharp, square edges. Beyond this radius, the corners of the square transition smoothly to simulate rounded edges, creating a more realistic intensity distribution.
Pure Square Radius: This radius defines the extent of the square with sharp edges.
Outer Rounded Region: Outside this radius, the intensity transitions smoothly to zero, creating rounded corners.
Adjusting the radius to define the pure square region and the transition to rounded corners.
Practical Tips
Start with Two Points: Begin with a simple configuration of two control points (center and pure square radius) for basic square spot designs.
Refine with More Points: Add additional control points to fine-tune the intensity transitions in the rounded regions.
Pure Square vs Rounded Transition: Experiment with different radii for the pure square region to balance sharp edges and smooth transitions.
By defining the intensity profile and pure square radius for the Square Laser Spot, you can create precise and realistic laser spot simulations tailored to your treatment requirements.
The Circular Laser Spot option allows you to define a laser spot with a circular shape. The definition process for the circular laser spot is identical to the one used for the Square Laser Spot. It uses a piecewise linear function to define the intensity profile, with control points specifying the intensity at different radii from the center to the edge.
For detailed instructions on adding and managing control points, refer to the Square Laser Spot section.
Key Differences
The main difference between the Square Laser Spot and Circular Laser Spot is the absence of the Pure Square Radius option in the circular configuration. This is because the circular spot has rotational symmetry and does not require a transition between sharp edges and rounded corners.
Steps to Configure
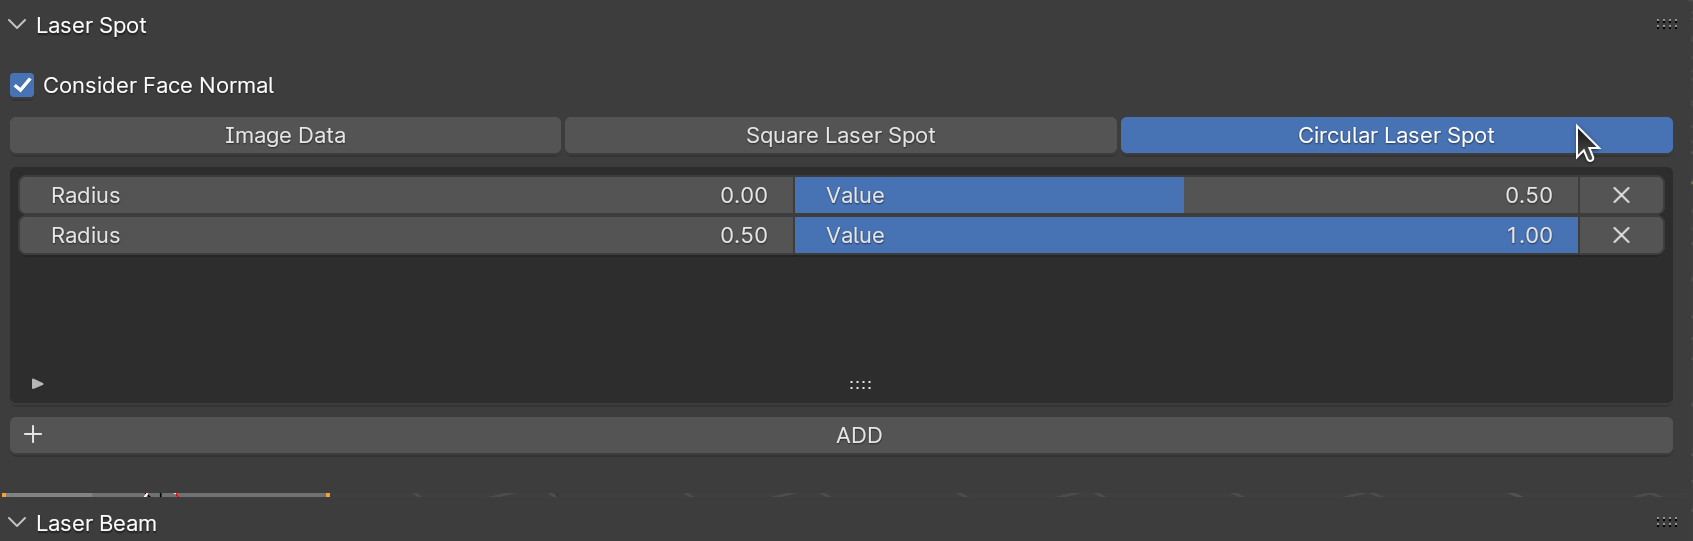
Select Circular Laser Spot Type
In the Laser Spot panel, select the Circular Laser Spot option from the horizontal enum.
Selecting the Circular Laser Spot type from the laser spot options.
Add Control Points
Use the ADD button to insert control points. The first control point defines the intensity at the center (radius = 0.0), while additional points define the intensity at increasing radii.
Adjust Control Points
Modify the Radius and Value fields for each control point to define the desired intensity distribution.
Refine the Intensity Profile
Add or remove control points as needed to fine-tune the intensity profile. Control points allow you to simulate gradual or abrupt changes in intensity from the center to the edge.
Practical Tips
Uniform Intensity: To create a uniform circular spot, define two control points with the same intensity value.
Radial Gradient: To simulate a gradual intensity drop-off, add multiple control points with decreasing intensity values at increasing radii.