Illumination Results and Post-Processing
The Results panel in LIATool provides tools for visualizing, analyzing, and managing simulation results. This panel allows users to view computed illumination data, adjust visualization thresholds, and compare multiple simulations.
Visualizing Simulation Results
Once a simulation is completed, the results are displayed in the Results panel. The computed illumination data is mapped onto the domain and visualized using a color gradient, governed by Blender’s Color Ramp tool.
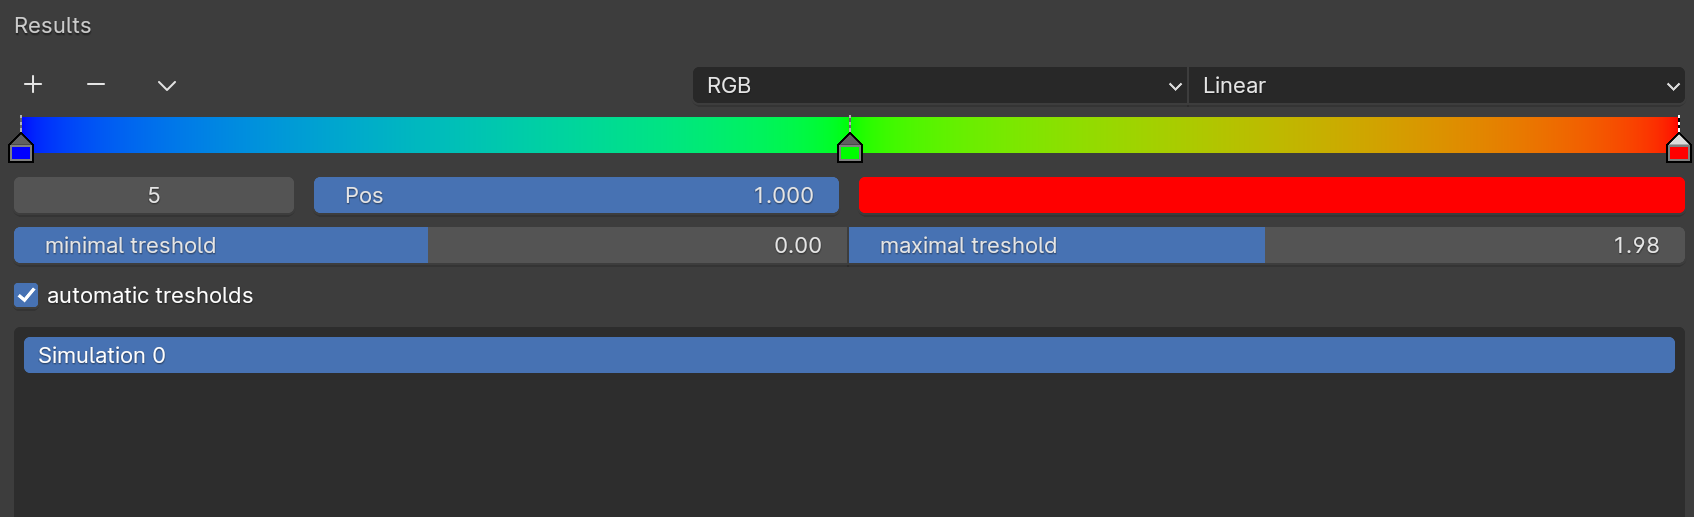
The Results panel displaying data after completing the first simulation.
The visualization uses Blender’s Viewport Shading mode to display results. Ensure this mode is enabled to see the results.
For instructions on enabling Viewport Shading, refer to the Blender Manual - Viewport Shading.
Adjusting Thresholds
The visualization can be tailored by adjusting the Minimum Threshold and Maximum Threshold, which define the range of values mapped to the color gradient:
Automatic Thresholds:
By default, Automatic Thresholds are enabled, automatically setting the minimum and maximum values to the smallest and largest values in the current simulation.
This ensures optimal contrast for each set of results.
Manual Thresholds:
To manually control the thresholds, disable the Automatic Thresholds checkbox.
Users can then set specific Minimum Threshold and Maximum Threshold values for custom visualizations.
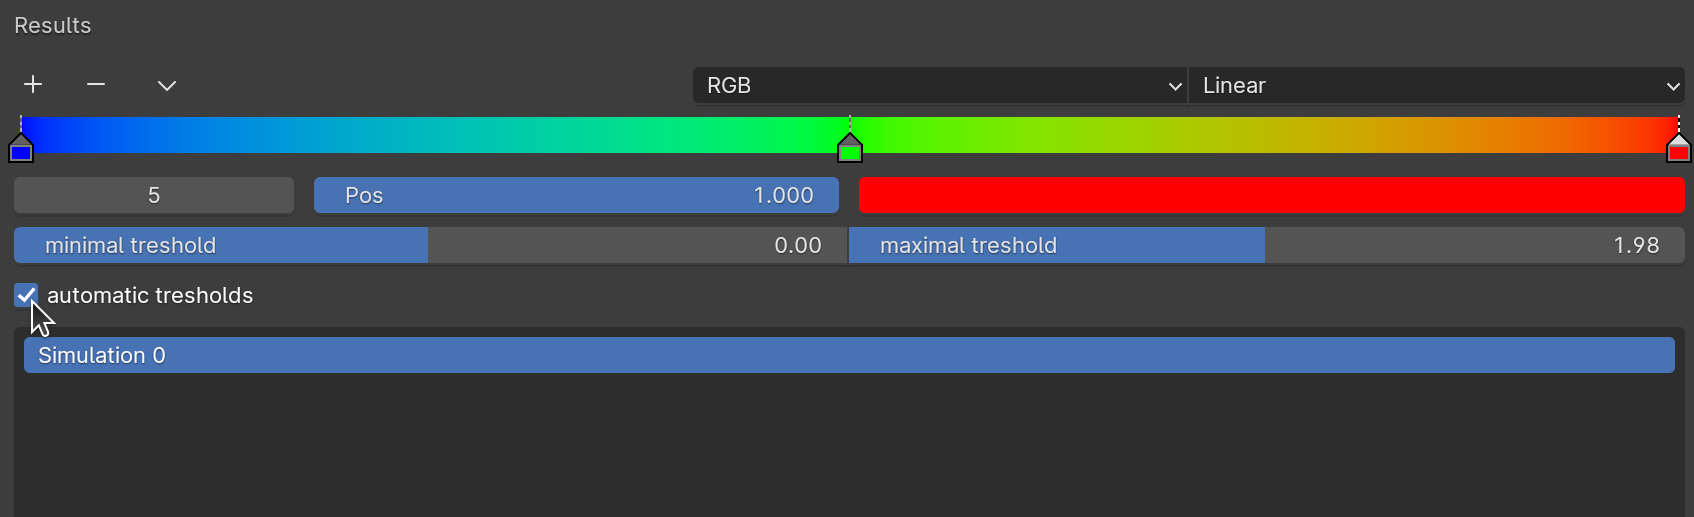
Enabling or disabling Automatic Thresholds in the Results panel.
For more information on the Color Ramp tool, refer to the Blender Manual - Color Ramp Node.
Comparing Multiple Simulations
When multiple simulations are computed, users can switch between them to compare results directly within the Results panel:
A dropdown menu located below the Automatic Thresholds checkbox lists all completed simulations.
Selecting a simulation from the menu updates the visualization to display the results for the chosen simulation.
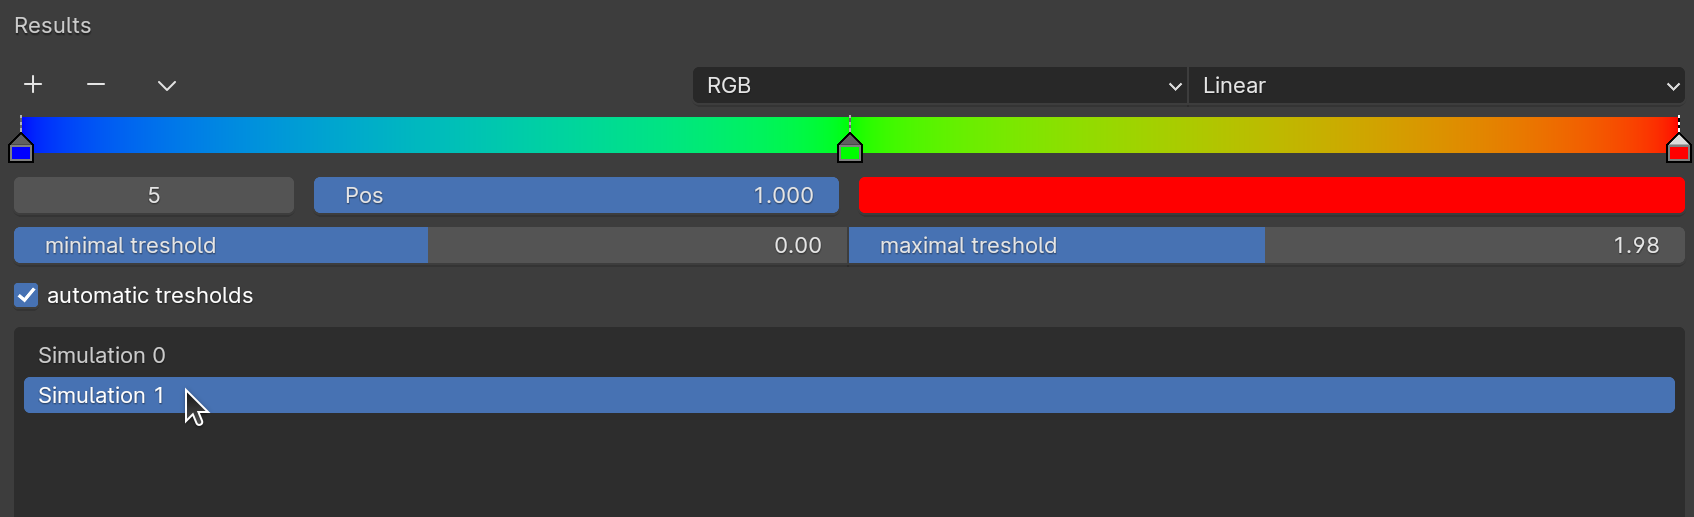
Results panel with multiple simulations and the option to switch between them.
This feature is particularly useful for comparing the effects of different process settings or visualizing cumulative changes over multiple steps.
Timeline for Step-by-Step Analysis
Blender’s Timeline tool enables step-by-step navigation through the simulation. Each simulation step corresponds to a frame in the timeline:
Use the Timeline panel (typically at the bottom of the Blender interface) to navigate frames.
Play, pause, or manually scrub through the timeline to analyze each step of the simulation.
For more details on using the Timeline, refer to the Blender Manual - Timeline.
Summary
The Results panel provides powerful tools for visualizing and interpreting simulation data. With features like automatic and manual thresholds, multiple simulation comparison, and integration with Blender’s native tools like Color Ramp and Timeline, users can efficiently analyze and refine their laser treatment designs.